Transformers
All transformers in skutil will take the arg cols=None (None being the default, which will automatically use all columns), which allows transformers to operate only on a subset of columns rather than the entire matrix. See SelectiveMixin for more information on the selective nature of some transformers.
Currently implemented TransformerMixin classes:
BoxCoxTransformer- Estimate lambda parameters to perform the (BoxCox transformation)YeoJohnsonTransformer- Estimate lambda parameters to perform the (YeoJohnson transformation)SpatialSignTransformer- Estimate the parameters for the (Spatial Sign transformation)SelectiveImputer- Impute a select set of features, leaving the others as they areSelectiveScaler- Scale a select set of features, leaving the others as they areFunctionMapper- Map a function to a set of features (useful for extremely messy incoming data). - Imagine we have the following dataframe in pandas (stored indf):
"""
| country | some_pct | some_currency |
|---------|----------|---------------|
| USA     | 56%      | $75,000       |
| MEX     | 62%      | $42,000       |
| FRA     | 75%      | $68,000       |
"""

import pandas as pd
from skutil.preprocessing import FunctionMapper

def fun(x):
    return x.replace('[\$,%]', '', regex=True).astype(float)

transformer = FunctionMapper(cols=['some_pct','some_currency'], fun=fun).fit(df)
>>> transformer.transform(df)

"""
yields...

| country | some_pct | some_currency |
|---------|----------|---------------|
| USA     | 56.0     | 75000.0       |
| MEX     | 62.0     | 42000.0       |
| FRA     | 75.0     | 68000.0       |
"""
This can easily be put into a sklearn Pipeline, for example:
from sklearn.pipeline import Pipeline
pipe = Pipeline([
    ('function_1', FunctionMapper(cols=['some_pct','some_currency'], fun=fun)), # the function mapper
    ('encoder',    OneHotCategoricalEncoder()), # maybe we want the next step to encode the categorical feature
    ('bc',         BoxCoxTransformer(cols=['some_pct','some_currency'])) # maybe now we want to transform these
])

>>> pipe.fit_transform(df)

"""
| some_pct | some_currency |country.FRA|country.MEX|country.USA|country.NA|
|----------|---------------|---------|---------|---------|----------|
| 0.396543 | 2.964437e+13  | 0.0     | 0.0     | 1.0     | 0.0      |
| 0.396547 | 5.656215e+12  | 0.0     | 1.0     | 0.0     | 0.0      |
| 0.396551 | 2.240639e+13  | 1.0     | 0.0     | 0.0     | 0.0      |
"""
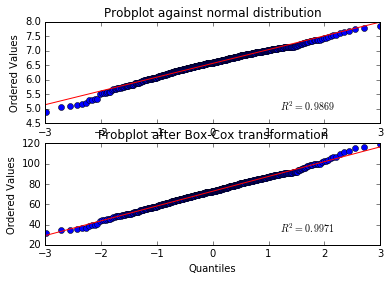
Example of BoxCox transformation results:
## Example using BoxCoxTransformer
import pandas as pd
from skutil.preprocessing import BoxCoxTransformer
from scipy import stats

## Create a matrix of two-columns
X = np.array([stats.loggamma.rvs(5, size=500) + 5,
              stats.loggamma.rvs(5, size=500) + 5]).transpose()

fig = plt.figure()
ax1 = fig.add_subplot(211)
prob = stats.probplot(X[:,0], dist=stats.norm, plot=ax1)
ax1.set_xlabel('')
ax1.set_title('Probplot against normal distribution')

Xdf = pd.DataFrame.from_records(data=X)
transformer = BoxCoxTransformer(as_df=False).fit(Xdf)
ax2 = fig.add_subplot(212)
prob = stats.probplot(transformer.transform(Xdf)[:,0], dist=stats.norm, plot=ax2)
ax2.set_title('Probplot after Box-Cox transformation')